Keeping history fast
Each of the 12 pairs holds ~6.5M candles, and the computed moments double that — before labels, trendlines and rules. After several rounds of index changes, table partitioning solved both query performance and history retention.
Case study · Own product · 2017–present
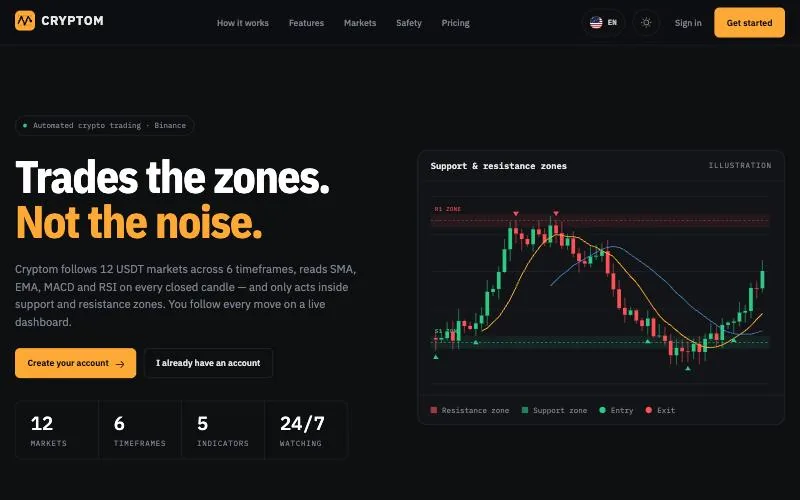
An automated trading bot that only acts inside support and resistance zones — and a live dashboard that shows users exactly what the bot sees.
12USDT markets
6timeframes, 1m to 1w
~78Mcandles (12 × ~6.5M)
150M+rows with computed moments
Trading on every indicator crossover means trading on noise. Cryptom computes indicators on every closed candle, but only acts when the price sits inside a support or resistance zone — one position per level, closed at a profit target.
Users follow the same candles and indicators the bot reads on a live dashboard. The free plan is the dashboard; Pro lets the bot trade on the user’s own Binance account.
Candles stream from Binance WebSockets for 12 USDT markets on 6 timeframes, from 1-minute to weekly.
Node.js · WebSocketsSMA, EMA, MACD, RSI and standard deviation are recomputed every time a candle closes, on every market and timeframe.
TypeScript workersA broker built for Cryptom routes messages and calculation results between services over WebSockets. Persistence workers store the history across PostgreSQL, MongoDB and SQLite, and Redis keeps the state some services need to recover after a restart.
WebSocket broker · PostgreSQL · MongoDB · SQLite · RedisWhen indicators line up inside a zone, the trade service opens one position per level and closes it at the profit target.
Binance APIOrders, balances and signals reach the user’s dashboard in real time. Accounts, settings and operations live in PocketBase.
PocketBase · WebSocketsEach of the 12 pairs holds ~6.5M candles, and the computed moments double that — before labels, trendlines and rules. After several rounds of index changes, table partitioning solved both query performance and history retention.
The first version, in 2017, ran entirely on MySQL, with the logic in triggers and stored procedures. Today that logic lives in Node.js and TypeScript services, each in its own Docker container.
Indicators, moments, labels, trendlines and rules are computed in parallel across 72 market and timeframe pairs. Services exchange those messages and results over WebSockets through a broker written for Cryptom, and Redis holds the state that lets a service pick up where it left off after a restart.
The bot asks for trading-only Binance keys with withdrawals disabled, starts in test mode, and auto-trading stays off until the user turns it on.
A simulator replays every pair since 2021, so buy and sell strategies are compared on history before they touch a real account.
Services ship as Docker images and run across Google Cloud, Fly.io and a home server exposed through Cloudflare Tunnel, without opening ports on the home network.
Node.js, TypeScript, Binance WebSockets, a custom WebSocket broker, Redis, PostgreSQL, MongoDB, SQLite, PocketBase, Docker, Google Cloud, Fly.io, Cloudflare Tunnel